Formula 1 has spent the last five seasons turning itself into one of the most watched annual sporting cycles on earth, and that cumulative audience number now sits close to the centre of every sponsorship conversation inside the paddock.
Official figures from Liberty Media put the global cumulative television audience for the championship at roughly 1.6 billion viewing sessions across a 24-round season, distributed across more than 180 territories and through a growing mix of linear broadcast, subscription streaming, and highlights-driven social-video clips.
For advertisers outside the traditional automotive, fuel, and luxury-watch verticals, that volume of distributed attention is difficult to replicate anywhere else in the annual sports calendar.
It is also why the category mix of Formula 1 sponsors has broadened steadily since the 2022 regulation reset, and why online betting and gaming brands, operating inside the regulated markets that permit the category, have moved from a small presence on a handful of cars to a structurally visible layer across teams, circuits, and broadcast overlays during a significant share of the season.


The reason regulated online operators keep expanding their motorsport visibility is not mysterious once the underlying media economics are examined. A single Grand Prix produces between six and eight hours of live television output across Friday, Saturday, and Sunday for a global audience that skews young, male, and relatively affluent.
This demographic that regulated online operators already target through digital channels and are willing to pay a premium to reach through live sports broadcasts.
Independent comparison portals such as https://www.legalsportsreport.com/online-gambling/ document the licensed operator landscape in the United States and adjacent markets, and the sheer breadth of that licensed market is part of why the category is now a meaningful buyer of motorsport inventory.
The rest of the article looks at the specific sponsorship formats that deliver that visibility, the media-economics math that governs how it is priced, and the structural forces that keep the trend moving upward through the 2026 season and beyond. All figures and framing assume an adult audience of 18 or 21 and over depending on jurisdiction, which is the demographic the regulated category is permitted to address.
Impressions math: How a grand prix weekend actually produces value
Sports-sponsorship measurement firms typically price a Formula 1 front-of-car sidepod logo using a straightforward three-factor model. The first factor is qualified visible-screen seconds, which is the cumulative duration the specific logo is identifiable on camera during live broadcast, replays, and post-session highlights, weighted for camera angle and resolution.
The second factor is audience-size adjustment, which applies the regional audience estimate for each broadcast market to those seconds. The third factor is a market-specific cost per thousand impressions, which differs sharply between mature live-sport advertising markets and secondary ones.
A well-placed sidepod logo on a front-running constructor typically accrues between 140 and 220 million qualified impression-seconds across a full season, at effective thousand-impression rates that compete closely with premium live television advertising.
For a regulated online operator with a defined licensed-market footprint, the combination of scale and audience profile is what makes the category competitive with alternative sports-marketing spend even before brand-affinity effects are considered.
The Inventory Layers That Produce Different Visibility Profiles
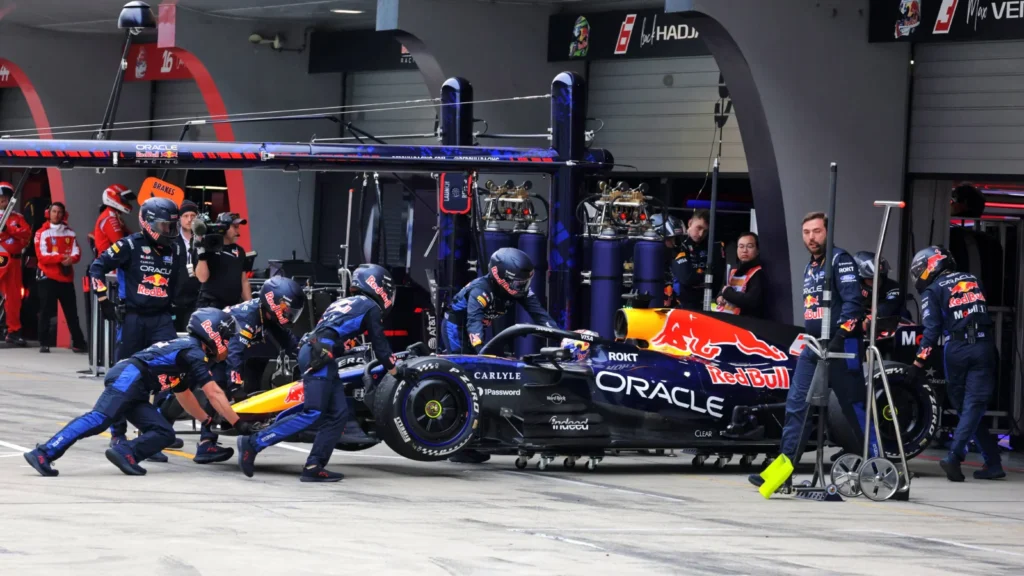
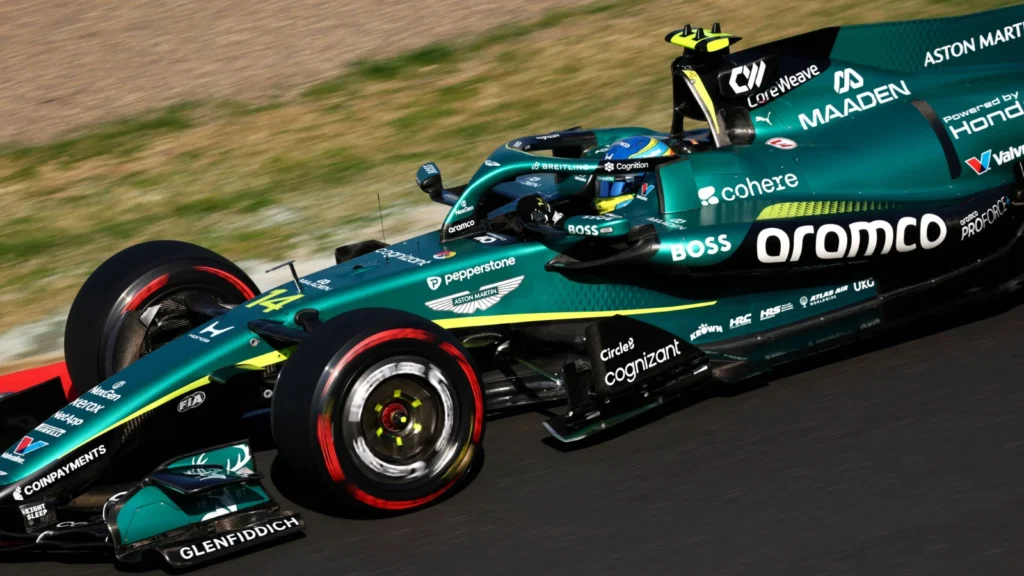
Formula 1 sponsorship now operates across five distinct inventory layers with materially different visibility profiles, and a mature advertiser selects a combination rather than a single layer. Front-of-car surfaces, including the halo, engine cover, and sidepod, produce the largest block of qualified visible-screen seconds per race but at the highest annual cost.
Rear-of-car surfaces, including the endplate and rear wing, produce shorter on-screen times but concentrate them during overtaking sequences, which often receive heavier replay attention. Circuit-level inventory, including trackside boards, run-off signage, and podium backdrops, produces location-specific visibility that varies sharply by circuit layout and by camera placement.
Driver and team-principal apparel generates secondary visibility through interviews, press conferences, and paddock walks. Finally, broadcast overlays delivered through official F1 graphics, timing screens, and race-weekend data visualisations have become a meaningful fifth layer, particularly on digital streaming platforms.
Regulated online operators typically enter the sport through a circuit-level inventory deal before graduating to team-level branding, which is why the footprint expands rather than simply swaps between properties once a brand establishes itself inside the paddock.
Why audience geography drives pricing more than total reach
The 1.6 billion cumulative audience number is headline-friendly, but the underlying geographic distribution is what shapes the price of any individual piece of Formula 1 inventory.
Roughly 40 percent of the cumulative global figure comes from European markets with long motorsport traditions, roughly 20 percent from the Americas, roughly 25 percent from Asia-Pacific, and the remainder from the Middle East, Africa, and smaller secondary markets.
For a regulated online operator licensed principally in one region, the effective value of global exposure is discounted against the portion of audience inside the licensed footprint, plus a lower-weighted credit for brand-recall effects in adjacent markets where the operator may expand in future.
That is why operator sponsorship deals are typically negotiated with regional exposure weighting written directly into the commercial terms, and why a car that performs strongly at European rounds commands a premium over an equivalent car that performs strongly at the season-opening rounds in the Middle East or the late-season rounds in Asia.
The pricing model rewards overlap between race-weekend audience geography and operator market licensing more than it rewards raw global impression volume.
Brand affinity: The layer that justifies the premium
Brand-affinity research consistently finds that Formula 1 viewers carry higher-than-average recall and favourability scores for sponsors who maintain a consistent presence across at least two consecutive seasons, and that gap widens for sponsors associated with front-running constructors.
Survey work commissioned by several sports-marketing consultancies across 2024 and 2025 put unaided recall for top-tier F1 sponsors at around 18 percent of regular viewers after a single full season, rising toward 34 percent after two consecutive seasons, compared with a baseline of around 6 to 9 percent for single-round trackside advertisers.
For regulated online operators, this multi-year compounding effect is structurally important because customer-acquisition economics in the category depend on converting familiar-brand prospects more easily than cold prospects.
The effective cost of a new registered customer declines meaningfully as brand recall rises, and that decline is what justifies the premium sponsors pay to maintain consistent team-level branding rather than rotating through single-round activations or shorter circuit deals.
Once a brand has committed to the category, staying committed is usually cheaper per marginal customer than exiting and returning.
How season structure and performance volatility changes the equation
Formula 1’s commercial calendar places the highest-viewership races in the middle third of the season and the championship-deciding rounds in the final third, and the resulting distribution of qualified impressions across the year is neither flat nor predictable.
A mid-grid constructor that performs above expectations during the championship run-in delivers substantially more qualified impressions than its pre-season pricing assumed, which is why sponsors increasingly structure deals with performance-adjusted pricing tiers rather than flat annual fees.
A reader following the current 2026 Formula 1 championship standings through the middle of the season gets a reasonable running estimate of which constructors are converting their sponsorship inventory into peak-window visibility and which are not.
For the regulated online operator, the practical consequence is that a team-level deal has become closer to a call option on performance than a fixed media-buy. That reshapes how the commercial conversation looks in the paddock between operator sponsors and team sponsorship leads, and it is one reason the sponsorship market inside the sport has become more dynamic since the 2022 commercial reset than at any point in the previous decade.
A side-by-side view of the major inventory layers
The table below summarises the five principal sponsorship inventory layers inside Formula 1, with rough annual pricing bands observed across the 2025 commercial cycle, the type of regulated advertiser each layer typically attracts, and the qualified-impression profile that justifies the pricing.
Figures are illustrative industry-reported ranges, not operator-specific commercial terms.
| Inventory Layer | Typical Annual Price Band | Main Advertiser Profile | Visibility Strength |
| Front-of-car sidepod | 25 to 60 million dollars | Large regulated brand building recall | Peak on-camera seconds across the season |
| Rear-of-car endplate | 10 to 25 million dollars | Mid-size brand targeting replay exposure | Concentrated during overtaking sequences |
| Circuit trackside boards | 3 to 12 million dollars | Regional operator or new market entrant | Event-specific, geography-weighted |
| Driver and team apparel | 5 to 18 million dollars | Lifestyle-adjacent regulated brand | Press-conference and paddock visibility |
| Broadcast graphic overlays | 4 to 15 million dollars | Tech-forward operator with streaming focus | Digital-first, data-visualisation linked |
The pricing bands overlap because teams and the commercial rights-holder package inventory differently across multi-year agreements, and because performance adjustments and audience-weighted clauses move the effective cost of each layer inside the commercial term.
The broader pattern is that regulated online operators tend to mix layers rather than concentrate spend on a single surface, producing a visibility pattern across a race weekend that is more distributed than a casual viewer would infer from any single on-screen moment.
What the public viewership data shows about the underlying growth
Public-facing viewership data is the backbone of every sponsorship pitch inside the paddock, because commercial teams cannot price inventory without defensible audience numbers.
Across the 2024 and 2025 seasons, average live television audience per round grew in most major markets, driven principally by growth in North America and Asia-Pacific, while European audiences held broadly steady at already-high levels.
Subscription streaming contributed a growing share of the total, particularly for the Sunday race broadcast window and the post-race highlights cycle. Statista data on Formula 1 global TV viewership makes the underlying growth pattern visible in clean year-over-year comparisons and helps explain why sponsorship prices across most inventory layers rose faster than inflation through the same two seasons.
For a regulated online operator evaluating entry, re-entry, or expansion inside the sport, the publicly reported audience trajectory is typically the first number that goes into the commercial case for any new deal, and it is the number that most readily justifies the premium over comparable spend in adjacent live-sport properties.
Practical signals an adult viewer can read on screen
A few on-screen signals during any given Grand Prix tell an adult viewer over 18 a useful amount about how the sport’s sponsorship economy is currently working, without requiring access to any confidential commercial data.
The five signals below cover the layers discussed earlier and can be read casually during the live broadcast window.
- Sidepod rotation: a regulated operator that moves from a minor livery logo to a sidepod position over one or two seasons is signalling that its market entry has converted into sustained investment, which is usually a sign of category growth.
- Trackside-board language: trackside boards that display the same operator across multiple circuits rather than only at home-market rounds indicate a multi-region commercial deal rather than a single-event activation.
- Driver and principal apparel: appearances of a sponsor on apparel during driver interviews and team-principal media slots are a secondary visibility layer that frequently signals a deeper multi-year agreement.
- Broadcast overlay credits: data-overlay credits that include an operator or regulated-brand name signal that the sponsor has bought into the digital-first portion of the inventory, which is the fastest-growing layer in the current commercial cycle.
- Podium and paddock boards: podium backdrops and paddock boards rotate by round but a consistent presence across the season is a reliable signal of a senior-tier commercial deal rather than a one-off event buy.
Running through these five signals across a single race weekend gives an adult viewer a reasonably accurate picture of which advertisers are in deep multi-year commitments and which are running single-event tests.
The pattern visible across the 2026 season so far suggests that the regulated online category is sitting firmly in the multi-year-commitment group across most inventory layers, which is consistent with the underlying media-economics case for the category inside the sport.
What to watch through the rest of the 2026 season
Three shifts are worth tracking through the remainder of the 2026 season as the commercial picture continues to evolve. The first is whether the broadcast-overlay inventory layer continues to grow faster than the physical-surface layers, because digital-first visibility now drives a disproportionate share of the category’s sponsorship growth and that trend shows no sign of slowing.
The second is whether regional weighting inside commercial deals becomes more formalised as audience geography continues to shift toward the Americas and Asia-Pacific, which would push more sponsorship pricing into performance-linked and audience-weighted structures rather than flat annual fees.
The third is whether the sport’s growing slate of United States-hosted rounds begins to pull more North American regulated operators into the paddock, which would further expand the regional profile of the category inside the commercial mix.
Together these three shifts suggest that the visibility arithmetic of Formula 1 sponsorship will continue to favour the regulated online category through the next commercial cycle, even if the specific sponsor lineup rotates between brands inside the category.
Frequently asked questions
How large is the Formula 1 global audience that sponsors are paying for?
Official figures from Liberty Media report a cumulative global television audience of roughly 1.6 billion viewing sessions across a 24-round season, distributed across more than 180 territories through linear broadcast, streaming, and highlights clips.
The number is a cumulative rather than unique figure and should be read as a distributed-attention total rather than a single audience count.
Which inventory layer produces the most on-screen exposure?
Front-of-car sidepod logos on front-running constructors produce the largest block of qualified visible-screen seconds per race, typically between 140 and 220 million impression-seconds across a full season for a top-tier placement. The exact number depends on the constructor’s on-track performance and on camera-angle allocation during the weekend.
Why are regional weightings so important in sponsorship pricing?
Because the 1.6 billion cumulative audience is distributed unevenly across territories, a regulated advertiser licensed principally in one region captures only the portion of that audience inside the licensed footprint, plus a lower-weighted credit for brand recall in adjacent markets. Commercial terms now often embed regional weighting directly in the pricing to reflect this.
Do multi-year sponsorships really produce better results than one-off activations?
Survey work across 2024 and 2025 indicated unaided sponsor recall of roughly 18 percent after a single full season rising to around 34 percent after two consecutive seasons, compared with 6 to 9 percent for single-round trackside-only advertisers. That compounding recall effect is what justifies the multi-year commitment premium.
How should an adult viewer interpret the sponsorship mix on any given weekend?
An adult viewer over 18 can read signals from sidepod placement, trackside-board consistency across circuits, driver and principal apparel, broadcast overlay credits, and podium boards to form a reasonable picture of which sponsors are in multi-year deals and which are running single-event tests. The signals are visible without access to any confidential commercial data.


