
Formula 1 teams now rely on data instead of intuition to find the best drivers. They analyze thousands of metrics, from lap times to tire management, to make decisions. Here’s how they do it:
- Key Metrics: Speed execution, car preservation, and adaptability are measured through telemetry, simulators, and real-track data.
- Data Sources: Teams use live track data, driver biometrics, and AI simulations to track performance.
- Junior Talent: To scout young drivers, metrics such as win ratios, podium rates, and stress responses are used.
- AI Tools: AI evaluates 150+ parameters, including braking consistency and communication skills, to predict driver potential.
- Cost Efficiency: Data-driven scouting cuts costs and improves team performance, with academy graduates delivering up to 18% more value.
This shift ensures driver selection is objective, efficient, and aligned with team goals.
Formula E Racing: Data Analytics and AI


Key Driver Performance Metrics
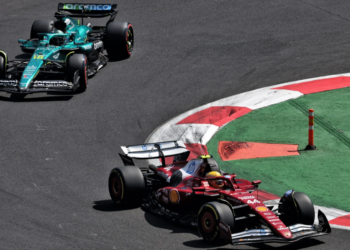
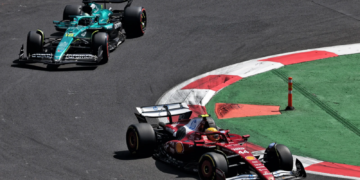
Speed and Race Skills
Teams use advanced telemetry to analyze how drivers handle speed and corners to fine-tune driver performance. AWS‘s Driver Performance metrics break cornering into three phases—entry, mid-corner, and exit—measured with lateral g-force data.
Racecraft is another critical focus, with data collection covering key areas such as:
| Skill Area | Measurement Points | Performance Indicators |
|---|---|---|
| Overtaking | Pass completion rates, closing speed gaps | Position retention percentage |
| Cornering | Entry/mid/exit g-forces, line consistency | Lateral acceleration efficiency |
Car Management Skills
Car management metrics help teams evaluate how well drivers preserve their vehicles during a race. Brake management is especially important. For example, McLaren‘s analysis showed Jenson Button consistently outperformed teammates by 0.2 seconds per lap in mixed conditions, thanks to his precise brake control.
Tire management is assessed through:
- Thermal camera data showing shoulder wear patterns
- Comparing stint lengths to simulation expectations
Mercedes‘ 2023 stats revealed George Russell achieved 97% tire efficiency on medium compounds, edging out Lewis Hamilton’s 94%.
Performance Across Conditions
Teams focus on drivers’ ability to perform under changing conditions. Wet-weather performance, in particular, is now heavily data-driven. Teams evaluate hydroplaning recovery and how drivers adapt to varying grip levels.
A standout example is Daniel Ricciardo’s 2016 Monaco performance, where his wet-dry lap time gap was 12% smaller than his rivals’. This set a high standard for wet-weather evaluation.
Simulators also help assess adaptability. Teams track how drivers respond to shifting track conditions, correct errors, and maintain acceleration consistency over multiple laps.
Data Collection Systems
Live Track Data Systems
Data is gathered through three main channels:
| Data Category | Metrics Tracked | Update Frequency |
|---|---|---|
| Driver Biometrics | Stress responses, reaction times | 100x/second |
| Race Performance | Sector times, tire degradation | Real-time |
Simulator Testing
Simulators are used to replicate exact race scenarios, including wet-weather conditions. AI-driven simulations test drivers across over 200 scenario combinations, evaluating factors like steering precision on a 1-10 scale. Teams use this to mimic specific race conditions, such as tire wear patterns or safety car restarts.
Junior Racing Data
When scouting talent in junior racing series, teams focus on four key metrics:
| Metric | Benchmark Example |
|---|---|
| Win Ratio | 0.35 (Piastri F2 2021) |
| Podium Rate | 0.65 (Piastri F2 2021) |
| Average Points/Race | Series-specific |
| Pole Position Rate | Series-specific |
Some programs have begun monitoring stress responses during overtaking maneuvers. This approach has cut development costs by 40% compared to older scouting methods.
SBB-itb-a66f0a9
Data vs Human Assessment
What Data Can’t Show
Live telemetry and simulator data are essential for evaluating drivers, but some qualities can’t be measured purely with numbers. Skills like leadership, clear communication with the team, and handling unexpected race scenarios often fall outside the scope of data analysis. Even with F1 teams tracking over 300 performance metrics, these less tangible factors still play a major role in decision-making.
Take McLaren’s 2023 driver evaluation program as an example. Partnering with AWS, they used machine learning to analyze 87 performance metrics. Yet, team leaders still leaned on psychometric tests – developed with insights from former champions – to assess the harder-to-measure traits.
| Assessment Type | Quantifiable Metrics | Non-Quantifiable Qualities |
|---|---|---|
| Data Analysis | Lap times, g-forces, tire use | Leadership, motivational skills |
| Human Evaluation | Radio clarity, media presence | Strategic thinking, pressure handling |
Mixing Numbers with Observation
Ferrari showcases how blending data with human observation can improve driver evaluation. They use natural language processing to review radio communications, pairing this with engineering reports. Drivers who provide over 85% technically accurate feedback earn extra evaluation points, even if their lap times are comparable to less communicative drivers.
Top teams have evolved their weighting systems to reflect this balance. For junior drivers, the focus leans heavily on data, with a 70/30 split between data and human factors. For experienced F1 candidates, the split becomes more even at 50/50. This shift acknowledges that data alone can’t predict how well a driver will perform at the highest level.
Red Bull takes this approach further with a weighted matrix emphasizing real-world performance. For instance, braking consistency is weighted at 70% for real-track performance versus 30% in simulations. Similarly, weather adaptation is prioritized at 80% on the track, helping the team validate simulator predictions with real-world outcomes:
| Performance Aspect | Simulation Weight | Real-Track Weight |
|---|---|---|
| Braking consistency | 30% | 70% |
| Tire management | 45% | 55% |
| Weather adaptation | 20% | 80% |
New Methods in Driver Scouting
AI in Driver Analysis
F1 teams are taking driver scouting to the next level by combining human expertise with cutting-edge AI systems. For example, AWS analytics now evaluates 150 parameters from junior racing series to create detailed driver profiles.
Mercedes has introduced some impressive tools in this area. One standout is their use of biometric analysis, including high-frequency eye tracking during wet-weather simulations. This goes beyond traditional methods like brake temperature monitoring, offering a way to assess how instinctively a driver makes decisions. They can link these behaviors to lap time consistency by analyzing visual scanning patterns, revealing a driver’s natural instincts. Additionally, their team radio analysis platform uses natural language processing to gauge how drivers handle stress during technical failures, aiming to keep negative sentiment variance under 15%.
| AI Analysis Type | Key Metrics | Target Threshold |
|---|---|---|
| Telemetry Processing | Sector consistency scores | 92% match to benchmarks |
| Biometric Analysis | Stress response (GSR) | <12% focus disruption |
| Communication Analysis | Technical feedback quality | 85% accuracy rate |
F1 Academy‘s Youth Programs
AI tools also enhance youth development programs like the F1 Academy, which identifies talent through data-driven methods. For example, their weighted scoring system evaluates 15 key factors from regional Formula 4 races, strongly emphasizing overtaking performance in DRS zones. Thanks to this approach, Mercedes has cut promotion decision times by 40% across its 12 partner racing schools.
Standardizing data collection has also boosted the efficiency of junior programs. With uniform sensor packages used across 40 regional series, teams can compare performance more easily. As a result, 18-22% of junior program budgets are now allocated to predictive analytics, ensuring better returns on investment.
Conclusion: The Economics of Driver Selection
How Data Shapes Driver Development
Data-driven methods are reshaping the economics of driver selection in Formula 1. For instance, Mercedes’ use of predictive modeling has cut rookie adaptation time by 70% compared to older scouting techniques. This efficiency isn’t just about speed – it saves money too. Consider Alpine: a simulator session costs £15,000, while a track test runs up to £450,000.
Team academies are also reaping the rewards. Red Bull’s internal data shows that their academy graduates hit the podium 63% of the time, compared to 41% for externally recruited drivers over five seasons. In addition, academy graduates deliver 18% more value than drivers brought in from outside.
| Investment Area | Cost Efficiency | Performance Metric |
|---|---|---|
| Academy Programs | 18% better value | 63% podium rate |
| Simulator Training | £15,000/session | 70% faster adaptation |
| Traditional Testing | £450,000/session | 41% podium rate |
The Business Behind F1 Teams
In today’s $135M cost cap era, teams allocate 15-20% of their budgets to youth development analytics. This approach isn’t just about finding talent but maximizing long-term value. For example, Williams chose Logan Sargeant after AI predicted he could boost the team’s brand value by £7M within three seasons.
McLaren offers another example. Using machine learning and biometric data, they’ve refined their Driver Performance models through a partnership with AWS. This doesn’t just improve driver development – it also opens doors for commercial collaborations.
However, data isn’t infallible. Haas learned this the hard way with Mick Schumacher. While simulator metrics looked promising, they failed to account for his adaptability in wet conditions – a shortcoming only revealed through traditional video analysis during the Brazil 2022 race.
READ MORE – Charles Leclerc says F1 must be more open-minded about reversing Monaco pit stop mandate
READ MORE – F1 Academy to get the Netflix treatment in 2025
READ MORE – F1 confirms release date for new season of Netflix’s Drive to Survive


Discussion about this post